UniPlot™
Create customizable reports for all your data
Why UniPlot?
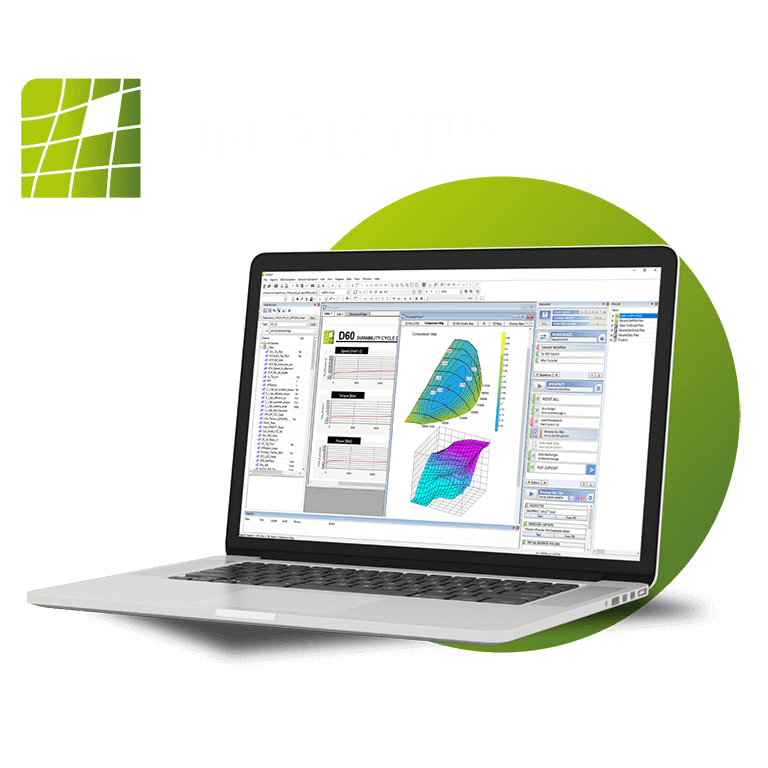
UniPlot was developed to visualize and analyze test data. With just a few mouse clicks, you can transform your data into 3D surface maps with color zones, contour maps with color fill, or plot 2D data into diagrams with several axes. Text objects, scanned photos and other drawing and labeling elements can be easily inserted into the document.
Data is crucial in all organizations, whatever their business area. More data is being produced than ever before and is increasing by the day.
Analysis, visualization, efficient use and data driven decisions all require powerful software. UniPlot‘s interface helps navigate through your data and visualize it, while its scripting module provides countless possibilities to analyze and transform it. Finally, its wide range of customization options let you produce professional reports with style!
Features
Data can be processed interactively or automated for repetitive tasks or analysis.
The power of UniPlot™ is its capacity to export customizable reports in multiple formats, to facilitate the decision process.
Plot your data selecting from numerous options of plot types (1D, 2D, 3D, waterfall, polar, etc.). Tune your graph: change the colors, styles, markers and more.
Contact our UniPlot™ experts

